How do I use the Performance Report?
Please note:
While you can view this data within a specific date range (as far as 27 months prior), the data is only valid up to the previous date from when the report is generated.
You can use the performance report to view visitor and earnings statistics based on transaction date by day, week or month.
-
1
-
First, select the preferred time period. You can choose from one of the preset options or select your own time period to run a report:
-
-

-
2
In addition to the standard visitor data such as Transactions, Commission, Visits, Searches and Conversion, you can also choose to include the following metrics:
- Integration code: If you have multiple Integration types
- Language: The language used by the visitor.
- Device: The device used by the visitor (desktop, tablet or mobile).
- Booker Location: The country in which the transaction was made.
- Hotel Country: The country of the hotel for which the transaction was made.
- Hotel City: The city of the hotel for which the transaction was made.
- Vertical: The vertical in which the transaction was made.
 3
The results can be grouped by day, week, month or simply view all the data for the selected time period which is also the default option:
3
The results can be grouped by day, week, month or simply view all the data for the selected time period which is also the default option:

4
The performance summary gives you a snapshot of the total metrics for the selected period. At the top of the report, you can see the dates for which your report was run, and the elements it is based on if selected.
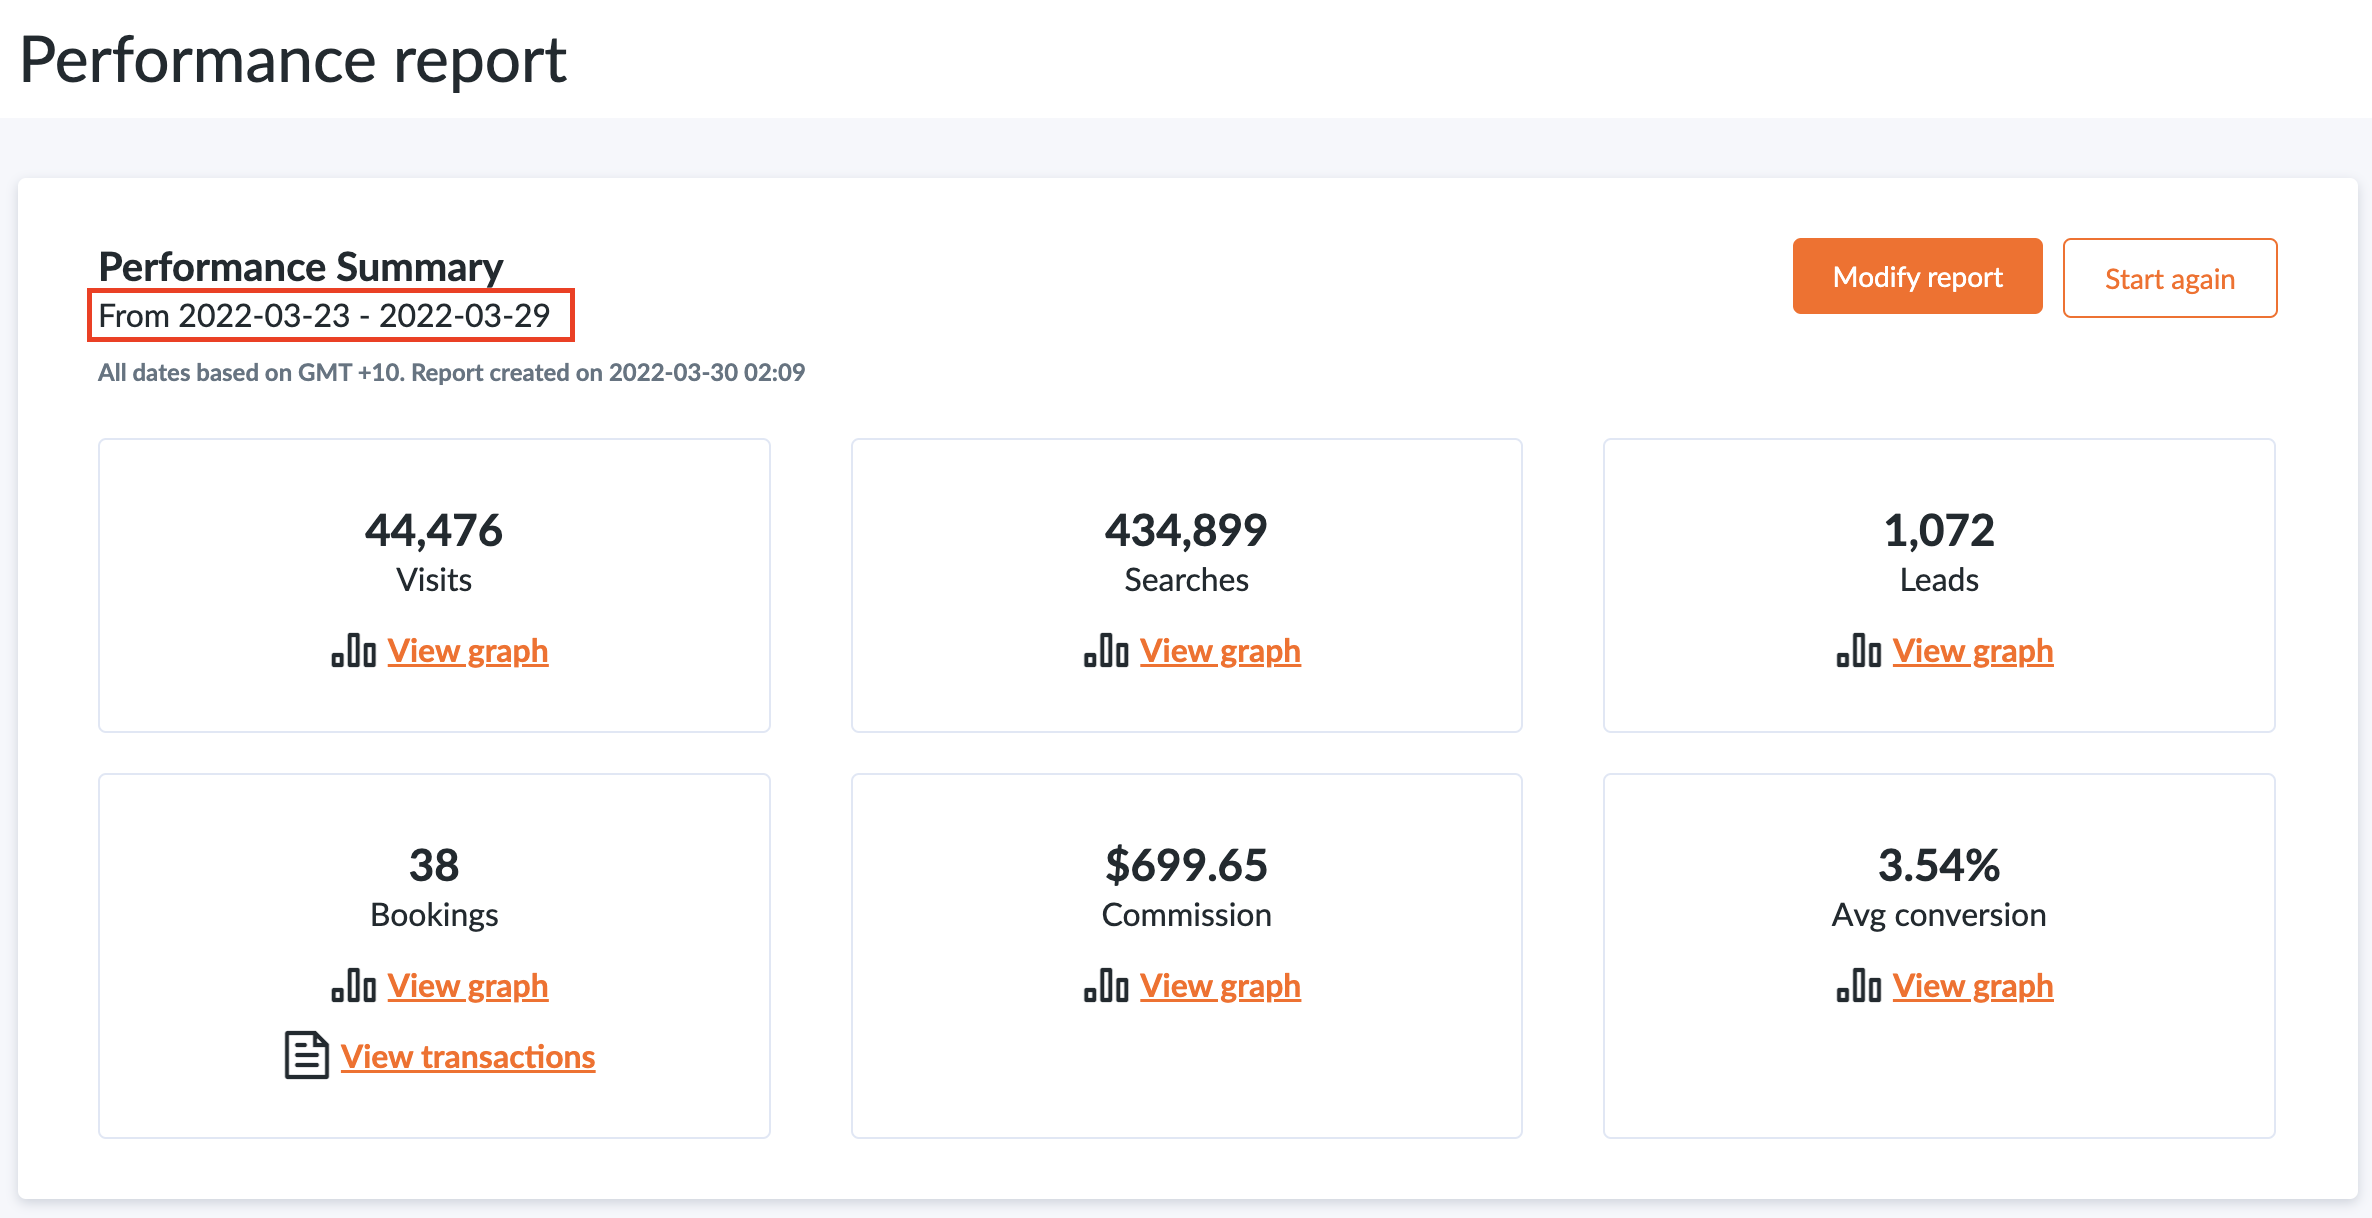
5
You can also view graphs or directly jump to the transaction report for the same period:
6
After running a report, you can either modify it, add data, or change any of the selections. Alternatively, clicking “Start Again” will clear the form so that you can generate a new report:

7
You can sort the results in the table by clicking on column headings: